Forcing
data
|
|
Combined volcanic and solar forcing data series
Greenhouse gas
concentrations for the
1860-2000 Simulation
Greenhouse gas
concentrations for the
2000-2100 IPCC scenariosSulfate aerosol forcing concentration : Olivier Boucher
Land-use fieldsStabilisation A1b-450 ppm scenario
Land-use data based on a combination of the crop dataset of Ramankutty and Foley (1999), and pasture from the HYDE dataset (Goldewijk, 2001) have been produced by Nathalie de Noblet (IPSL/LSCE) to give a fraction of grid-cell covered by crop and pasture on a 0.5x0.5° global grid for each from 1700 to 1992.
The recommended methodology is that each model keeps its vegetation map as used in stream 1 simulations, and change only the crop and pasture fraction as provided in this dataset. Nathalie has a number of python scripts that could be used to interpolate the vegetation maps to replace current crop and pasture areas for the preindustrial and has offered to help the interested modelling groups (contact her at: Nathalie.de-noblet@cea.fr).
- The methodology for deriving the annual land-use fields for crop and pasture is described in the report:
" Designing historical and future land-cover maps at the global scale for climate studies", by Nathalie de Noblet-Ducoudré and Jean-Yves
Peterschmitt (pdf file )
- the land-use maps for cropland and pasture fractions are available as NetCDF files at 0.5° resolution from Nathalie de Noblet's
DODS server:
http://dods.extra.cea.fr/data/p25nath/DIVA/ForcingData/Vegetation/ over the period 1700-1992 (historical data)
http://dods.extra.cea.fr/data/p25nath/DIVA/ForcingData/Vegetation/crops_1700TO1992_0.5d.nc
http://dods.extra.cea.fr/data/p25nath/DIVA/ForcingData/Vegetation/pasture_1700TO1992_0.5d.nc and over the period 1993-2100 for scenario A1B:
http://dods.extra.cea.fr/data/p25nath/DIVA/ForcingData/Vegetation/crops_1993TO2100_0.5d_A1b.nc
http://dods.extra.cea.fr/data/p25nath/DIVA/ForcingData/Vegetation/pasture_1993TO2100_0.5d_A1b.nc
The dataset still needs some more extensive checking. In case you notice any problem please contact Nathalie de Noblet (nathalie.de-noblet@lsce.ipsl.fr) and Aurore Voldoire (aurore.voldoire@meteo.fr) .
New forcing fields for stream two multi-decennal simulations
Stabilisation A1b-450 ppm scenario:
Data provided by Detlef van Vuuren on 12-2007 :
all forcing data excel file : A1450.xls
(The equivalent CFC11 concentration has not been calculated yet, it will be provided in january 2008).
Hamonisation method (.doc):harmonisation.doc
Text files containing global/regional emission/concentration (GHG, air pollutants,halogenated gases) :
List of files : legend.txt
Zip text files : A1b_450.zip
Gridded emissions on a 0.5° x 0.5° grid for GHG and air pollutants.
maps_450.zip
Ozone fields:
The ozone fields for the stream 2 simulations for years 1850, 1900, 1950, 1980, 2000, and 2100 for scenarios A1, A2 and B1, are available as monthly mean NetCDF files on a server at UiO: http://folk.uio.no/bjoergr/ensembles
(for more information on the dataset contact Bjørg Rognerud bjorg.rognerud@geo.uio.no )
Combined
volcanic and solar
forcing data
series
Table
of forcings
(.xls)Descriptif of volcanic time series (.doc)
Descriptif of solar time series (.doc)
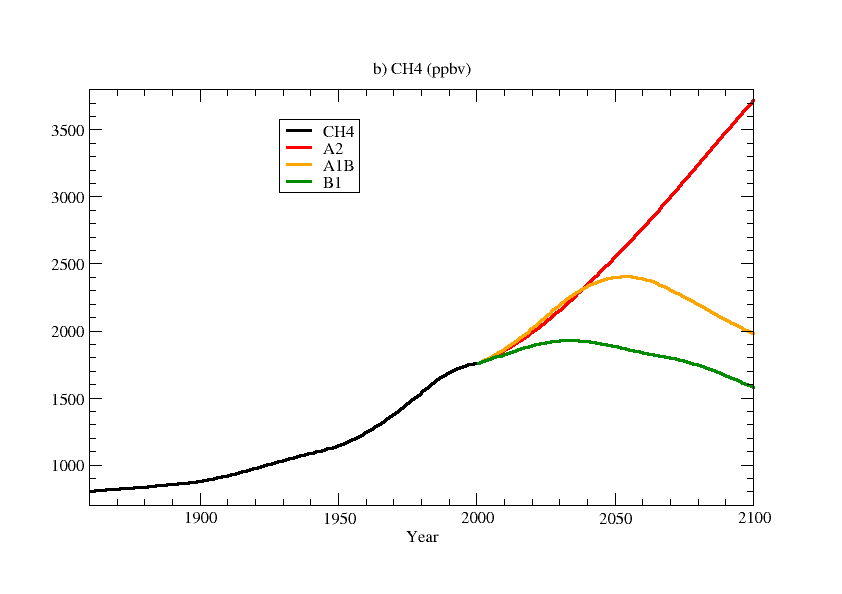
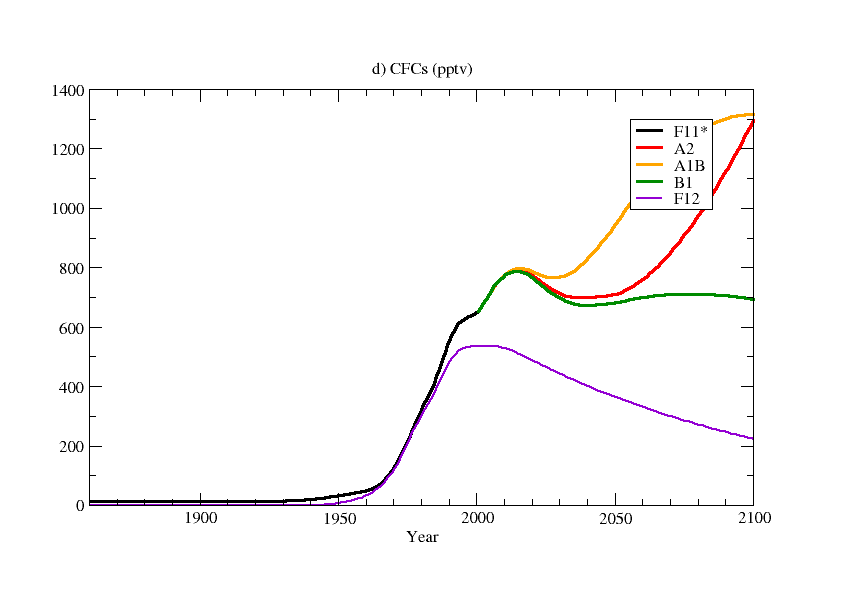
Greenhouse gas concentrations for the 1860-2000 Simulation
Table of forcings
CO2-CH4-N2O
CFC-12 CFC-11
CFC-12 CFC-11
CH4 :Descriptif of series
-->File in ASCII
N2O :Descriptif of series
-->File in ASCII
Equivalent CFC-11 :Descriptif of series
-->File in ASCII
Computation
of the radiative forcing : -->File
in .xls
CO2-CH4-N2O
CFC-12 CFC-11
For
all scenarios : -->File
in .xls
A1B : ->File in ASCII
A2 : ->File in ASCII
B1 : ->File in ASCII
Aerosol files (.nc)
A1B : ->File in ASCII
A2 : ->File in ASCII
B1 : ->File in ASCII
Figures:
 |
 |
 |
 |
Sulfate aerosol forcing concentration : Olivier Boucher
DocumentationAerosol files (.nc)