Input Data
(last updated: Sep. 30, 2008)
Page Contents:
- Atmospheric Forcing
- Land Surface Parameter data
- Forcing data download

1. Atmospheric Forcing
The atmospheric forcing data which will be provided to the
participants is listed below. It will be provided in
NetCDF format,
using the conventions outlined on the
Assistance for Land Modeling Activities
(ALMA)
web site. Further details can be found on that web site.
| Variable Name | Description | Units (MKS) |
| Tair | Near surface air temperature | K |
| Qair | Near surface specific humidity | kg/kg |
| PSurf | Surface pressure | Pa |
| SWdown | Surface incident shortwave radiation | W/m2 |
| LWdown | Surface incident longwave radiation | W/m2 |
| Rainf | (Total) Rainfall rate | kg/(m2 s) |
| CRainf | Convective rainfall rate | kg/(m2 s) |
| Snowf | Snowfall rate | kg/(m2 s) |
| Wind_N | Near surface northward wind component | http://www.cnrm-game.fr/spip.php?article111&lang=antd> |
| Wind_E | Near surface eastward wind component | http://www.cnrm-game.fr/spip.php?article111&lang=antd> |
|
* It is assumed that most land surface schemes will use the total rainfall rate (Rainf)
and the mean wind speed (magnitude computed from Wind_N and Wind_E),
but additional information has been added for generality (e.g. CRainf:
the total rain rate is the sum of the convective and the large
scale/stratiform rain rates).
Experiment 1
data is provided at a 0.5 degree resolution
at a 3 hour time step over the regional window defined as -20 to 30 east
longitude, and -5 to 20 north latitude. This corresponds to a 101x51
grid which uses a cylindrical equidistant or platte carre projection.
Each forcing file corresponds to a single year. There are 4 files
available, from 2001 through 2004. Each file begins on Jan. 1 at 0Z,
and ends at Dec. 31, 24Z (note that this implies that the forcing
values for the last time step for a given year are identical to the
those for the initial time step for the following year). This dataset
is based purely on numerical weather prediction (NWP) forecast model output
diagnostics (from ECMWF).
For convenience (and possible use by other projects), the atmospheric forcing
data have been provided on a rectangular grid.
Note that while there are 5151 grid points, only 3650 correspond to land
points (i.e. those containing a non-negligible fraction of
land using the provided ECOCLIMAP land mask).
Results only need be reported for these points. However, one may
report results on grids with all 5151 points with the non-land points
flagged.
A sample NetCDF header for Experiment 1 is given
here.
As an example, the total Exp.1 rainrate averaged over the year 2004, is
shown below in mm day-1.
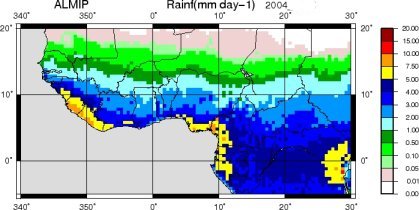
Exp.1 (NWP-based) precipitation averaged over the
entire year 2004.
Experiment 2
data is provided at a 0.5 degree resolution
at a 3 hour time step over the regional window defined as -20 to 30 east
longitude, and -5 to 20 north latitude (as in Exp.1).
There are atmospheric forcing data for the year 2004
(and soon, 2005).
This dataset is
based on the merging of numerical weather prediction (NWP) forecast model output
diagnostics (from ECMWF) and remote sensing-based products. The
downwelling longwave and shortwave radiative fluxes for 2004 are from
the OSI-SAF
(Ocean and Sea Ice Satellite Application Facility)
and the precipitation is from
EPSAT)
(Estimation of Precipitation by SATellite)
product available within AMMA-SAT (AMMA-PRECIP). The use of remote
sensing-based products based on MSG has resulted in fairly consistent
forcing: an example is shown below.
In 2005, the downwelling radiative fluxes are from
LAND-SAF
(LAND Satellite Application Facility).
Documentation describing the
Shortwave
and
Longwave
flux algorithms are available.
Note that the satellite data is only incorporated
during the monsoon months (since these are the only months for which
EPSAT data is currently available).
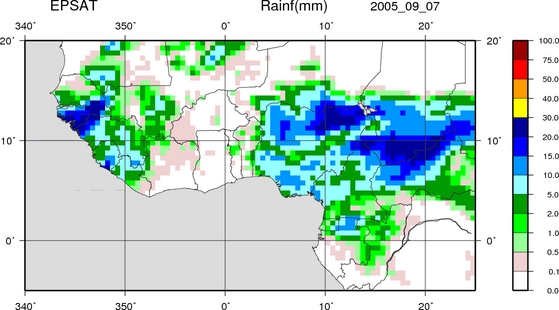
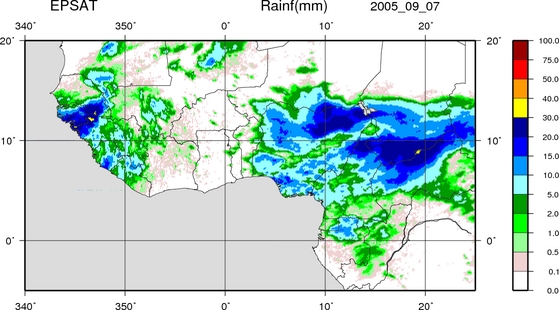
An example of the EPSAT 0.10 degree precipitation estimate (used
for
Exp.s 2-3: lower panel) and the aggregated values (used for Exp .2: using
a 0.5 degree resolution: upper panel) for Aug. 7, 2005.
The total Exp.2 rainrate averaged over the year 2004, is
shown below in mm day-1. The difference bewteen the Exp.2
rain rates less the Exp.1 values for the same period is also shown
(lower panel).
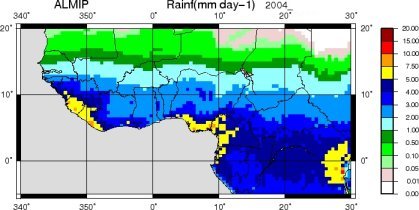
Exp.2 merged precipitation averaged over 2004.
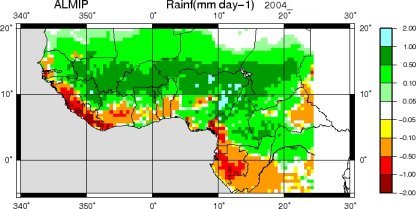
Difference in annually averaged rain rate for 2004
: Exp.2 less Exp.1 values. There is a general northward shift in the
active zone of precipitation in Exp.2.
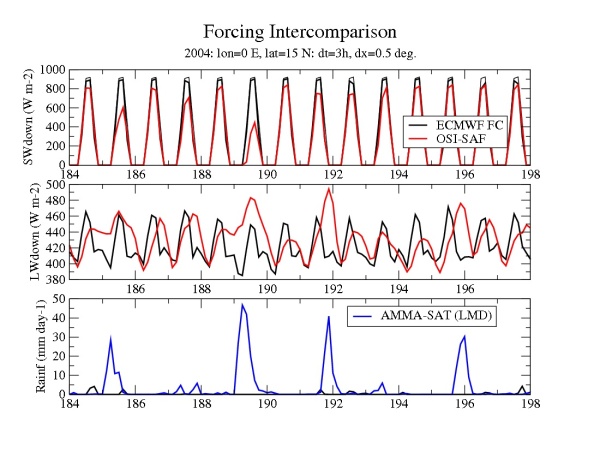
An example of a time series from the Exp. 2 forcing dataset at a
single grid point. This point was selected because the NWP-based data
placed the zone of active precipitation well to the south, as is
reflected in the low rainfall (Rainf) plot (lowest panel: black curve)
and the high solar radiation (uppermost panel: thick black
curve). The precipitation given by the AMMA-SAT product (lowest panel:
blue curve) is significantly larger, showing a farther northward
penetration
of the active precipitation zone associated with the WAM. The OSI-SAF
downwelling shortwave (uppermost plot: red curve) and longwave fluxes
are also shown. Note that the OSI-SAF shortwave radiation is
significantly reduced on DoY 185 and 189, corresponding to two rain
events seen in the AMMA-SAT precipitation. The latter two rain events
on DoY 192 and 196 occur at night, therefore the OSI-SAF longwave
radiation has a strong response. Note that the NWP longwave
radiative flux is strongly correlated with the solar cycle, while
the SAF based product is better correlated with the near-surface
atmospheric air temperature (it is computed with a significant
contribution from this variable in addition to cloudiness information).
Experiment 3
data is provided at a 0.5 degree resolution and 3 hourly time step (as in Exp.s 1-2).
This merged 0.5 degree dataset for 2002-2007 is currently being tested
and consists in ECMWF atmospheric state variables, and
TRMM-3B42 3-hourly data for 2002-2007
for the precipitation. OSI-SAF radiation flux data is used for the summer 2004 as in
Exp.2,
but in contrast with
Exp.2,
LAND-SAF for all available months from 07-2005 to 2007 are used for Exp.3 (in Exp.2, this product was only used in summer months).
Plots of the Exp.1, 2, and 3 radiation and precipitation monthly averages are shown
here.
We would like to acknowledge Remi Meynadier of IPSL/Université Pierre et Marie Curie (UPMC)
for providing us the TRMM-3B42 data on the ALMIP 0.5 grid for 2002-2007.
Precipitation Input Check
In order to ensure that you are reading the input precipitation data
correctly and using the grid mask (compressed land-only vector) information correctly, here is a
simple table which gives precipitation averages (mm and mm
day-1 in parenthesis) over the land vector (LAND). In addition, averages
for the sub-period June-July-Aug-Sept are also given. NOTE that these
are the pixel averages, not the actual area-weighted averages.
This is provided as an aid to to those running the experiments.
Note that an updated version of the EPSAT precipitation product
has been used to create a new forcing dataset as of May, 2007
(here referred to as Exp2b).
| Exp. | Year |
LAND | LAND (JJAS) |
| 1 | 2004 | 753 (2.06) | 357 (3.07) |
| 2 | 2004 | 813 (2.22) | 435 (3.57) |
| 2b | 2004 | 725 (1.98) | 347 (2.84) |
| 1 | 2005 | 824 (2.26) | 398 (3.26) |
| 2 | 2005 | 775 (2.12) | 348 (2.85) |
| 2b | 2005 | 777 (2.13) | 356 (2.91) |
|
The monthly average precipitation (mm day-1) for Exp2(b) is shown in the Figures below
(the data in the forcing files).
Note that the zone east of 25 degrees E is masked since the
satellite-based forcings do not cover this region (the forcings
default to NWP data over this region, and are therefore the same as in Exp1).
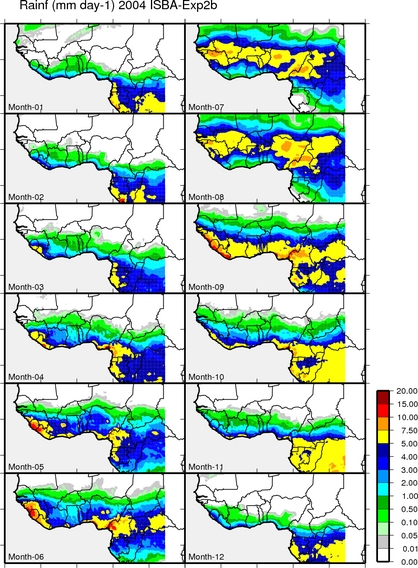
Exp.2(b) monthly precipitation averages for
2004.
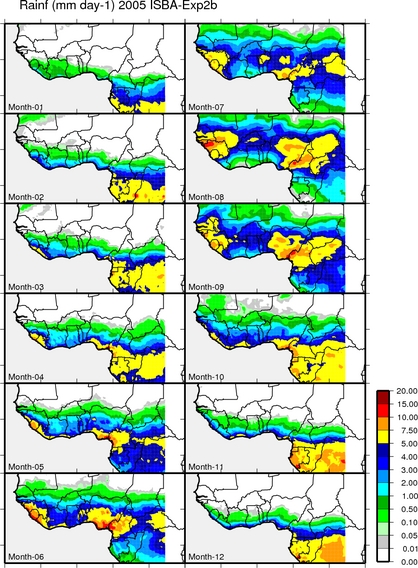
Exp.2(b) monthly precipitation averages for 2005.

Radiative and Precipitation Forcing Monthly AVG plots
Plots of the monthly average fluxes can be viewed here.
The experiment numbers corresponding to each Exp. are shown below.
Exp. numbers in brackets imply that the forcing are the same as those for the Exp. not in brackets.
| Year | Rainf | SWdown | LWdown |
| 2002 |
1[2],
3 |
1[2, 3] |
1[2, 3] |
| 2003 |
1[2],
3 |
1[2, 3] |
1[2, 3] |
| 2004 |
1,
2,
3
|
1,
2[3]
|
1,
2[3]
|
| 2005 |
1,
2,
3
|
1,
2,
3
|
1,
2,
3
|
| 2006 |
1,
2,
3
|
1,
2,
3
|
1,
2,
3
|
| 2007 |
1,
3
|
1,
3
|
1,
3
|

2. Land Surface Parameter data
The land surface parameter data is based on values from
ECOCLIMAP
used at Meteo-France. Soil parameters and monthly varying (for a
single climatological annual cycle) vegetation parameters are provided
for both aggregated or tile-based land surface schemes.
ECOCLIMAP monthly average LAI (Leaf
Area Index)
The monthly averaged LAI from ECOCLIMAP aggregated to a 0.5
degree spatial resolution.
This data is used for ALMIP experiments 1 and 2.
Note that the LAI values in ECOCLIMAP actually use a decadal
time step. A climatological annual cycle is used (so that the
year in the date above is irrelevant).
NOTE, that there are 2 land masks in the forcings. The ECMWF land mask
is given in the forcing just as general information. We ask that
modelers use the land mask in the land forcing parameter files
(ecoclimap*.nc)
when reporting results to us. As we are only examining the land
surface
in ALMIP, users have 2 options (which ever is better for them). They
can either:
- Report results on the full 2D grids as in the forcing files, but
with all non-land points FLAGGED
- Report results on a compressed land vector (which will defined in
early April)
Obviously the latter option results in considerably smaller files,
but again, this will be up to the participants (whichever option is
easier for them).

3. ALMIP Forcing data downloads
Server Access
The ALMIP input data server is password protected. In order to obtain
the password and login information, please contact us.
The ftp server hostname is ftp.ammasat.ipsl.polytechnique.fr
The directory with data for downloading is almip.
The current list of files to be used in ALMIP is shown below:
- Forcing_AMMA_0.5_2002.nc.gz
- Forcing_AMMA_0.5_2003.nc.gz
- Forcing_AMMA_0.5_2004.nc.gz
- Forcing_AMMA_0.5_mrg_2004_v2.nc.gz
- Forcing_AMMA_0.5_2005.nc.gz
- Forcing_AMMA_0.5_mrg_2005_v2.nc.gz
- ecoclimap-2.nc.gz
- ecoclimap_tiles-2.nc.gz
The Forcing*gz files are gzipped and in NetCDF format. The yearly forcing
data is at a three-hour time step on a 0.5 degree cylindrical
equidistant (platte carre) grid (101x51 grid points). Each Forcing* file begins
at 00UTC Jan. 1, and ends on 24UTC Dec. 31 of the same year.
The files with the mrg extension indicate the combined
NWP forcing and satelite product forcings.
The ecoclimap*z files contain the land surface data. Several fields
vary approximately every 10 days (36 time values). The
file ecoclimap_tiles-2.nc.gz contains land surface data for multiple
tiles or patches at each grid box. Note that the ECOCLIMAP files with the
2 extension are to be used.
Listing of Current (and Pending) Data on the server
The data which can currently be downloaded are shown below. Each cell
corresponds to gridded data covering a year-long period.
Last update on Sep. 30, 2008.
| File Type (Input data) | 2001 | 2002 | 2003 | 2004 | 2005 | 2006 | 2007 |
| ECMWF 0.5o | | | | | | | |
| Merged (ECMWF+EPSAT+SAF) 0.5o | | | | | | | |
| Merged (ECMWF+TRMM+SAF) 0.5o | | | | | | | |
| Merged 0.1o | | | | | | | |
| ECOCLIMAP 0.5o | | | | | | | |
| ECOCLIMAP Tiles 0.5o | | | | | | | |
| ECOCLIMAP 0.1o | | | | | | | |
| ECOCLIMAP Tiles 0.1o | | | | | | | |
|
Currently available data files (on the ALMIP server) are indicated
using green shading, and files which will soon be available (are under
preparation) are indicated using yellow shading. Note that ECOCLIMAP
files contain climatological data for a single annual cycle, so that
a single year-long file can be used for all years.

Sample NetCDF header for Experiment 1
netcdf Forcing_AMMA_0.5_2003 {
dimensions:
	x = 101 ;
	y = 51 ;
	level = 1 ;
	timestep = UNLIMITED ; // (2921 currently)
variables:
	int timestep(timestep) ;
		timestep:units = "timesteps since 2003-01-01 00:00:00" ;
		timestep:title = "Time steps" ;
		timestep:tstep_sec = 10800.f ;
		timestep:long_name = "Time step axis" ;
		timestep:time_origin = " 2003-JAN-01 00:00:00" ;
	int x(x) ;
		x:valid_range = 1, 101 ;
		x:axis = "1D" ;
		x:units = "-" ;
		x:long_name = "Navigation in x direction" ;
		x:associate = "x" ;
	int y(y) ;
		y:valid_range = 1, 51 ;
		y:axis = "1D" ;
		y:units = "-" ;
		y:long_name = "Navigation in y direction" ;
		y:associate = "y" ;
	int level(level) ;
		level:valid_range = 1, 1 ;
		level:axis = "1D" ;
		level:units = "-" ;
		level:long_name = "Level Index (above surface)" ;
		level:associate = "level" ;
	float time(timestep) ;
		time:units = "seconds since 2003-01-01 00:00:00" ;
		time:calendar = "gregorian" ;
		time:title = "Time" ;
		time:long_name = "Time axis" ;
		time:time_origin = " 2003-JAN-01 00:00:00" ;
	float lon(y, x) ;
		lon:valid_range = -20.f, 30.f ;
		lon:axis = "2D" ;
		lon:units = "Degrees East" ;
		lon:long_name = "Latitude" ;
		lon:associate = "y x" ;
	float lat(y, x) ;
		lat:valid_range = -5.f, 20.f ;
		lat:axis = "2D" ;
		lat:units = "Degrees North" ;
		lat:long_name = "Longitude" ;
		lat:associate = "y x" ;
	float land_mask(y, x) ;
		land_mask:valid_range = 0.f, 1.f ;
		land_mask:axis = "2D" ;
		land_mask:units = "0 (water) or 1 (for land point)" ;
		land_mask:long_name = "Land Mask" ;
		land_mask:associate = "y x" ;
	float height(level) ;
		height:valid_range = 2.f, 100.f ;
		height:axis = "1D" ;
		height:units = "m" ;
		height:long_name = "Distance in the atmosphere above the surface" ;
		height:associate = "level" ;
	float Tair(timestep, level, y, x) ;
		Tair:valid_range = 213.f, 333.f ;
		Tair:axis = "4D" ;
		Tair:units = "K" ;
		Tair:long_name = "Near surface air temperature" ;
		Tair:associate = "time level y x" ;
		Tair:missing_value = 1.e+20f ;
	float Qair(timestep, level, y, x) ;
		Qair:valid_range = 0.f, 0.03f ;
		Qair:axis = "4D" ;
		Qair:units = "kg/kg" ;
		Qair:long_name = "Near surface specific humidity" ;
		Qair:associate = "time level y x" ;
		Qair:missing_value = 1.e+20f ;
	float Wind_E(timestep, level, y, x) ;
		Wind_E:valid_range = 0.f, 75.f ;
		Wind_E:axis = "4D" ;
		Wind_E:units = "m/s^1" ;
		Wind_E:long_name = "Near surface eastward wind component" ;
		Wind_E:associate = "time level y x" ;
		Wind_E:missing_value = 1.e+20f ;
	float Wind_N(timestep, level, y, x) ;
		Wind_N:valid_range = 0.f, 75.f ;
		Wind_N:axis = "4D" ;
		Wind_N:units = "m/s^1" ;
		Wind_N:long_name = "Near surface northward wind component" ;
		Wind_N:associate = "time level y x" ;
		Wind_N:missing_value = 1.e+20f ;
	float PSurf(timestep, y, x) ;
		PSurf:valid_range = 5000.f, 110000.f ;
		PSurf:axis = "3D" ;
		PSurf:units = "Pa" ;
		PSurf:long_name = "Surface atmospheric pressure" ;
		PSurf:associate = "time y x" ;
		PSurf:missing_value = 1.e+20f ;
	float Rainf(timestep, y, x) ;
		Rainf:valid_range = 0.f, 0.02f ;
		Rainf:axis = "3D" ;
		Rainf:units = "kg/m^2s" ;
		Rainf:long_name = "Rainfall rate" ;
		Rainf:associate = "time y x" ;
		Rainf:missing_value = 1.e+20f ;
	float Snowf(timestep, y, x) ;
		Snowf:valid_range = 0.f, 0.02f ;
		Snowf:axis = "3D" ;
		Snowf:units = "kg/m^2s" ;
		Snowf:long_name = "Snowfall rate" ;
		Snowf:associate = "time y x" ;
		Snowf:missing_value = 1.e+20f ;
	float SWdown(timestep, y, x) ;
		SWdown:valid_range = 0.f, 1360.f ;
		SWdown:axis = "3D" ;
		SWdown:units = "W/m^2" ;
		SWdown:long_name = "Surface incident shortwave radiation" ;
		SWdown:associate = "time y x" ;
		SWdown:missing_value = 1.e+20f ;
	float LWdown(timestep, y, x) ;
		LWdown:valid_range = 0.f, 750.f ;
		LWdown:axis = "3D" ;
		LWdown:units = "W/m^2" ;
		LWdown:long_name = "Surface incident longwave radiation" ;
		LWdown:associate = "time y x" ;
		LWdown:missing_value = 1.e+20f ;
	float CRainf(timestep, y, x) ;
		CRainf:valid_range = 0.f, 0.02f ;
		CRainf:axis = "3D" ;
		CRainf:units = "kg/m^2s" ;
		CRainf:long_name = "Convective Rain rate" ;
		CRainf:associate = "time y x" ;
		CRainf:missing_value = 1.e+20f ;

// global attributes:
		:file_name = "Forcing_AMMA_0.5_2003.nc" ;
		:CreatedBy = "Aaron Boone at CNRM Meteo-France" ;
		:title = "Atmospheric Forcing for AMMA from ECMWF FC data interpolated to 0.5 deg grid" ;
		:production = "Transfered to the single file on 20060208 at 120007.070" ;
}
|
