Microwave Land Emissivity
Modelling
Overview
-
Mean AMSU emissivity curves sorted out by scan position
and by surface type have shown remarkably stable patterns over the months (Karbou et al. 2005). This property is very interesting because it
means that it is possible to characterize each surface type by a function
that describes the emissivity angular and the frequency variations. It also
means that, at a first stage, a one month period of emissivity
estimations is enough to derive such functions
-
Two microwave emissivity parameterizations have been proposed to
estimate the land emissivity at AMSU frequencies and the scanning
conditions in order to help processing AMSU measurements over land
surfaces ( Karbou 2005). Both parameterizations are derived from
previously calculated land emissivities directly from satellite
observations and take into account different surface types from bare
soil to areas with high vegetation density. The first parameterization
uses best-fit functions derived from microwave observations whereas the
second parameterization is based on the first one with the use of a
mean nadir emissivity map at 23.8 GHz. The use of a nadir emissivity
map has been found useful for a more reliable surface description.
-
the emissivity model has been developed using data from a
limited area (+/- 60° in latitude and longitude). The model's
coefficients have been updated using global data.
-
The emissivity parameterizations have been successfully
evaluated by comparing emissivity and Tb simulations to target
emissivity and to Tb observations.
The best-fit functions
The parameterization coefficients are function of the frequency, of the
scan position and also of the surface types (according to the BATS
climatology). The coefficients as well as near-nadir mean AMSU-A and
AMSU-B emissivity maps are computed over a one month period. Given a
frequency and a surface type, the AMSU-A emissivity could be expressed
by:
FOV is the AMSU-A scan position (varies from 1 to 30). P1, P2, P3, P4,
P5 and P6 are the polynomial fit coefficients for a given AMSU-A
frequency (23, 31, 50 and 89 GHz).
In the same manner, the AMSU-B emissivity could modelled using:
FOV is the AMSU-B scan position (varies from 1 to 90). P1, P2, P3, P4,
P5 and P6 are the polynomial fit coefficients for a given AMSU-B
frequency (89 GHz and 150 GHz).
By construction, the coefficient P6 represents the mean
emissivity at nadir and could be updated using near nadir emissivity
atlases. It is worthy to mention that the best-fit functions could be
constructed so that the P6 coefficients represents the emissivity
at 53°. In this case, mean emissivity atlases from SSM/I could be
used to describe the emissivity variation with the zenith angle.
Evaluation of the parameterization
coefficients
-
The parametrizations have been tested and successfully
evaluated using data from year 2000 ( Karbou 2005).
In the last mentionned study, the parametrization coefficients have
been calculated over a limited region : (60S to 60N) in latitudes and
(60W to 60E) in longitudes. The parametrization coefficients have been
updated to include multi-sensor data at a global scale.
-
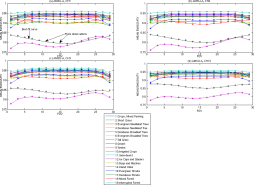
The last 2 weeks of August 2005 have been used to derive
global best-fit coefficients for AMSU-A and AMSU-B. The following
figure shows Mean emissivities for AMSU-A surface channels sorted out
by FOV position and by surface type. Asterisks symbols indicate mean
emissivities derived from satellite observations and solid curves are
for polynomial functions to fit the angular variation of the
emissivity. Results are given for (a) AMSU-A channel 1 (23.8 GHz), (b)
channel 2 (31 GHz), (c) channel 3 (50 GHz) and (d) channel 15 (89 GHz)
-
The first two weeks of September 2005 have been used to
evaluate the AMSU angular parameterizations. "True emissivities" are
emissivities directly calculated from observations and "simulated
emissivities" are emissivities calculated using our parameterizations.
-
Two methods have been used to simulate the emissivities: (1) the first
one uses only the angular parameterization
coefficients (called hereafter SIM1) and (2) the second method uses
both the parameterization coefficients and a near-nadir mean AMSU
emissivity atlas averaged using data from August 2005 (called hereafter
SIM2). In this case, mean emissivities at nadir will replace the
coefficient P6.
- Global statistics are given in the following tables.
Performances of the first
parametrization
| AMSU-A channels |
Mean bias (TRUE-SIM1) |
Std (TRUE-SIM1) |
Correlation (TRUE, SIM1) |
| 1 |
-0.0001 |
0.0534 |
0.7786 |
| 2 |
-0.0000 |
0.0514 |
0.7978 |
| 3 |
-0.0003 |
0.0470 |
0.7917 |
| 15 |
-0.0012 |
0.0533 |
0.7670 |
Performances of the second
parametrization
| AMSU-A channels |
Mean bias (TRUE-SIM2) |
Std (TRUE-SIM2) |
Correlation (TRUE, SIM2) |
| 1 |
-0.0054 |
0.0266 |
0.9519 |
| 2 |
-0.0054 |
0.0253 |
0.9571 |
| 3 |
-0.0028 |
0.0248 |
0.9488 |
| 15 |
-0.0025 |
0.0312 |
0.9276 |
|