|
|
|
|
|
|
|
|
|
|
|
|

CHAGAL is a FORTRAN-based program calling NCAR graphics subroutines based on NCAR GKS graphical package. Input data manipulation is performed via FA* routines package developed in Météo-France. Geographical set-up is done bmy EGGX subroutines developed in Météo-France as well.
The syntax of CHAGAL-calling command is :
- where output_format_file is :
| NCGM | : binary cgm format (default) | ||
| NOEXIST_X11 | or | NX11 | : non existingX11 window |
| TEXT_DUMP | or | TXTD | : text dump format |
| PS_COL_PORT | or | PSCP | : postscript color portrait |
| EPS_COL_PORT | or | ESCP | : encapsuled postscript color portrait |
| EPSI_COL_PORT | or | ISCP | : encapsuled postscript interchange color portrait |
| PS_MONO_PORT | or | PSMP | : postscript mono portrait |
| EPS_MONO_PORT | or | ESMP | : encapsuled postscript mono portrait |
| EPSI_MONO_PORT | or | ISMP | : encapsuled postscript interchange mono portrait |
| PS_COL_LAND | or | PSCL | : postscript color landscape |
| EPS_COL_LAND | or | ESCL | : encapsuled postscript color landscape |
| EPSI_COL_LAND | or | ISCL | : encapsuled postscript interchange color landscape |
| PS_MONO_LAND | or | PSML | : postscript mono landscape |
| EPS_MONO_LAND | or | ESML | : encapsuled postscript mono landscape |
| EPSI_MONO_LAND | or | ISML | : encapsuled postscript interchange mono landscape |
- where -H | -h | -HELP |-help | -? | ? is
this help text.
The format of the script is determined by the actual implementation of FORTRAN in the site. The script consists of a sequence of namelists named NAML defining segments of complete picture. The information to be passed to CHAGAL is where the input data to be taken from, which variable is to be considered, what to do with these data (to plot them, to subtract them from something else, to accumulate them with previous ones, or just to keep thelm in memory), further what is the desired arrangement of graphical segments on a page, what are further requirements concerning the labelling etc...
As an example consider the need to plot from file DATAF ishypsis field on 500 hPa level with minimum contour 504 dkm and maximum contour 600 dkm, with contour interval 8 dkm. The possible script file in this case reads :
_&NAML
CFD='./DATAF',_&END
CVARFA(0) ='GEOPOTENTIEL',
NTNZ=0,
CVAR='HIGHT',
CVARUN='dkm',
VARSC=.01,
CPREF='P',
VLEV=500.,
VCMN=504.,
VCMX=600.,
VCI=8.,
Now having prepared this script (assume the name namefile) user is ready to launch CHAGAL. CHAGAL reads in-line parameter the name of script. Examples commands are :
If you use default output_format_file (NCGM) :
after CHAGAL ends successfully the NCAR 's computer graphics metafile named gmeta appears in the working directory. User can then convert this metafile to other graphical format using program ctrans. To convert gmeta to the PostScript file toto.ps one has to enter :
You can visualize your gmeta file using idt product.
on ANDANTE in the directory : (This version is an old version using HP Fortran F90 - all of the parameters and spectral mode are not yet avaiable)
The default is the name of file from previous namelist segment, the first namelist has the initial value CFD='undefined'.
The character used in the labels marking the local maxima in the contoured field.The default is `H'.
The format in which user wants the labels on contours and high/low marks to be written. The meaning of CLLFMT is the same like the format descriptors in FORTRAN FORMAT statement. The available formats are : I1 to I10, F2.1 to F10.9 and E4.1 to E10.7.The default is empty string which means that the labelling format is left to be automatically set up by NCAR software.
The character used in the labels marking the local minima in the contoured field.The default is `L'.
The string which is put to the upper-left corner of the page identifying the map for dissemination purposes.The default is an empty string ` `.
The prefix of the vertical level in FA* input file.The default is `UNDF'.
The label put to the information panel of a plot. Normally this label is composed automatically from strings CVAR, CVARUN , and for 3D variables also from VLEV. User can completely overwrite this automatically created label by CTITLE, if it contains at least one non-blank character.As the title is plotted using procedure from PLOTCHAR package user can include control sequences to the string to get Greek alphabet letters and/or further sophisticated formatting (for further information see Appendix ).
The default is an empty string.
The name of variable to appear in the information panel of the plot.As the label is plotted using procedure from PLOTCHAR package user can include control sequences to the string to get Greek alphabet letters and/or further sophisticated formatting (for further information see Appendix ).
The default is `undefined'.
The character array (0:1) with the names of variable components under which their have been written to the input FA*file. For scalar variable (NTNZ =0) only CVARFA(0) is significant. For vector CVARFA(0), respectively CVARFA(1) will be considered as x-component, respectively y-component of the vector.The default are `undefined'.
The name of units of plotted variable after scale VARSC and offset VAROFF having been applied.As the label is plotted using procedure from PLOTCHAR package user can include control sequences to the string to get Greek alphabet letters and/or further sophisticated formatting (for further information see Appendix ).
The default is an empty string.
The IDENS parameter specifies the interval in grid points between twowind plots.The default is 4.
The parameter defining the dashing of contours. IMDSH=0 means no dashing, IMDSH=-1 means all contour levels smaller than VCLDSH will be plotted dashed, IMDSH=1 means all contour levels greater then VCLDSH will be plotted dashed.The default is 0.
The parameter defining how many frames are put on a page and how they are positioned. There are 3 existing types for the moment :IPTYP=0-1 frame on a page, portrait orientationThe default is 0 in the beginning but after IPTYP is defined in the firt namelist segment it remains until the user changes it again. If LACCUM is .true. the values of variable read from the input file CDF are added to the values from previous namelist segment. After this accumulation the resulted data are ready to be plotted and/or to be accumulated with the values in further namelist segment. Should be also noted here that this procedure can be effectively used also for plotting difference plots when the user enters VARSC in the first namelist segment with opposite sign and then accumulates it with the later data.
IPTYP=1-2 frames on a page, portrait orientation
IPTYP=2-4 frames on a page, portrait orientation
The default is .false..
If LCOLF is .true. color filling of isolines is active. Values of selected isolines mode is fixed. LFRAME must be .true..Only for SURFGEOPOTENTIEL, TEMPERATURE and HUMIDITY at SURF, 850, 700, 500.The default is .false..
If LCOLL is .true. color mode for isolines is active. Permits the superposition of two charts, one with color filling mode, the other with isolines color mode. In this case dashes isolines are red and continus in black. For the same chart if LCOLL and LCOLF are .true. then LCOLF is put automatically to .false..The default is .false..
If LDIFF is .true. the variables read from the input file CDF are subtracted from data from previous namelist segment. After the subtraction the difference is ready to be plotted but the original data values read in the current namelist segment are stored to contingently undergo further differenting in next namelist segment.The default is .false..
Activates plooting of E zone.The default is .false..
If LFRAME is .true. a new frame is used,the geographical background is plotted and all required operations with data (plotting accumulating etc...) are performed above this new frame. If user wants to superpose the contour plot or wind plot on the previous plot or if user just wants to perform any numerical operation (accumulation, differentiation) with the current data he or she have to set LFRAME=.false..The default is .true..
If LGRID is .true. grid points are superposed to chart.The default is .false.
If LHI is .true. the labels marking the local maxima of the contoured field are plotted.The default is .true.
If LHILOV is .true. the highs and/or lows marking labels include also the maximal or minimal values of the field. The numerical value is converted to the string contingently using CLLFMT formatting directive and plotted as a subscripts of CHIT or CLOT characters.The default is .true..
Activates infos of wind in label zone : min, max, and scale of arrows if TYPEW='A'.The default is .false..
If LISOL and LCOLF are .true. the isolines are suppressed.The default is .false..
If LLBLL is .true. the isolines labels are suppressed.The default is .false..
If LLO is .true. the labels marking the local minima of the contoured field are plotted.The default is .true..
If LNOCAD is .true. the label info cadre is suppressed; only the chart is displayed.The default is .false..
If LPLTC is .true. after all set-up and other operation are finished the contour or wind flags plot is normally performed. User sets LPLTC=.false. e.g. in case of the chain of accumulation of variables when all accumulation are not already finished.The default is .true..
User sets LXF .true. if he or she wants to plot variable from instantaneous fluxes field produced latest by old cycle 11r2. In that case the first row in the data array is considered as a value at « the pole » and is skipped.The default is .false..
LZOOM is the main switch for zooming. ZOOLON1, ZOOLON2, ZOOLAT1, ZOOLAT2 are then considered.The default is .false. in the beginning but once user sets different value to LZOOM it remains unchanged until the next user's intervention.
If NCL>0 CHAGAL sets up automatically the contour levels between computed minimum and maximum of input data to produce at least NCL contour levels.The default is 0. If NCLEM>0 CHAGAL considers NCLEM elements in the array VCLEM and if contour levels of such values are processed contour lines on such levels have double thickness.
If NCL=0 CHAGAL considers VCMN (the minimal contour level), VCMX (the maximal contour level), and VCI (the contour interval) and sets up contour levels.
If NCL<0 CHAGAL considers (-NCL) elements of array VCL and picks these values as the contour levels.
The default is 0.
For scalar variables NTNZ=0, for vectors NTNZ=1 (it controls how many elements of CVARFA are considered).The default is .
If TYPEW='A' then the wind representation is : arrows.The default is 'F'. The offset to be added to each data value before the data are further processed. The used formula is VARSC*DATUM+VAROFF.
If TYPEW='F' then the wind representation is : flags..
The default is 0.
The scaling factor to multiply each data value before the data are further processed. The used formula is VARSC*DATUM+VAROFF.The default is 1.
The contour interval to be taken into account if NCL=0 and VCMN <VCMX.The default is 0.
The array of prescribed contour levels. If NCL<() then (-NCL) elements of VCL are considered, otherwise VCL has no effect.The VCL has no meaningful default values.
The référence contour level for dashing. If IMDSH =-1 on all contour levels smaller than VCLDSH the contours will be plotted dashed, if IMDSH=1 on all contour levels greater then VCLDSH the contours will be plotted dashed.The default is 0.
The array of contour levels which contour lines should be drawn with a double thickness. If NCLEM>0 then NCLEM elements of VCLEM are considered, otherwise VCLEM has no effect.The VCLEM has no meaningful default values.
VCLLO changes the value of standart width isoline.The default is 1,5.
The minimal contour level to be processed. VCMN is considered only if NCL=0.The default is 0.
The maximal contour level to be processed. VCMX is considered only if NCL=0.The default is 0.
The vertical level in hPa of input data. It is considered only if CPREF ='P `. After converting to the string this value appears in the information panel of the frame.The default value is 0.
Specifies the overscaling used for the length of arrows or flags wind representations.The default value is 1,0.
ZOOLAT1 is latitude and ZOOLAN1 is longitude of lower-left corner of geographical area to be zoomed from the whole domain. ZOOLAT2 is latitude and ZOOLAN2 is longitude of upper-right corner of the zoom area. The parameters are considered only if LZOOM=.true..ZOOLAT1 and ZOOLAT2 have to be from <-90.,+90.>, in degrees.
ZOOLON1 and ZOOLON2 have to be from <0.,360.>, in degrees.
These parameters have no meaningful default values.
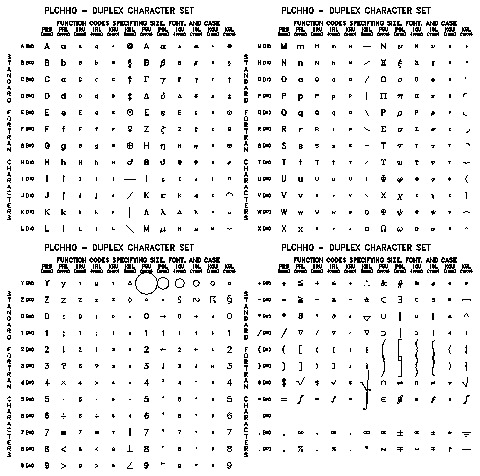
The text of the entered string is scanned from left to right and plotted. However, if a function-code signal character (a colon " :" by default) is encountered, the following characters are interpreted as function codes until the next function-code signal appears. Here is the partial list of function codes :
R - selects the Roman fontFor further information see documentation NCAR Graphics Fundamentals or manual pages on plchhqq(1).
G - selects the Greek font
P - selects characters of principal size
I - selects characters of indexical size
K - selects characters of cartographic size
U - selects uppercase characters
L - selects lowercase characters
B - selects a subscript level
S - selects a superscript level
E - ends subscripting or superscripting
N - causes a return to normal level
C - carriage return
Example :
Using an enclosed copy of one PLOTCHAR documentation page one can understand
that :