
The method of dynamic adaptation for forecasting the wind and precipitations is described. The results of its application in an interesting weather situation are presented. It is particularly usable when intense precipitations are the consequence of the orographically forced ascent. Vertical motion at high resolution is obtained by a short integration of the model (ALADIN), after an interpolation of the fields of a lower resolution model onto a finer mesh, with better description of the relief. As precipitations are directly dependent to the vertical velocities, a knowledge of these makes possible the diagnosis of the intensities which is made in this work in 3 different ways: statistically, by adiabatic adjustment and 1D model.
The method of adaptation dynamic for forecasts of the wind and precipitations is a particular approach, where a numerical method is adapted to describe some small scale phenomena, disregarding the general description of the problem. It is conceptually rather close to the dynamic initialization of the digital model. The method consists initially of an interpolation of the solution of a driving model, sometimes global one, on the mesh of the adaptational model. The number of the vertical levels is reduced. A maximum of 30 minutes integration (see agar and Rakovec, 1999 for all the details about the estimation of the temporal scale of dynamic adaptation) is then applied, during which the fields adapt to the new representation of orography. The diabatic part of physics in the model for the adaptation can be omitted to accelerate calculation. The fundamental and essential assumption for a dynamic adaptation of the wind is that the wind at the surface is dependent on synoptic forcing. In the Fig. 1 the result of dynamic adaptation of the wind at the resolution 2.5 km is presented.
Figure 1: November 7, 1997, 6 UTC, 10 m wind in the mountainous area over western Slovenia, forecast by operational model ALADIN/SI (resolution 11.2 km), interpolated in a grid of 2.5 km (left) and the forecast obtained by dynamic adaptation (right). Note the maximum wind arrow. The relief is also traced.
In a hydrostatic model, vertical velocity is a diagnostic consequence of the modeling of the horizontal wind. The vertical velocity is employed like one of the two key variables for the forecast of precipitations, which result from orographically forced ascent. The second variable is the absolute humidity, provided by the driving model (low resolution). On the fig. 2 one can see how vertical velocity adapts to a detailed description of the relief.

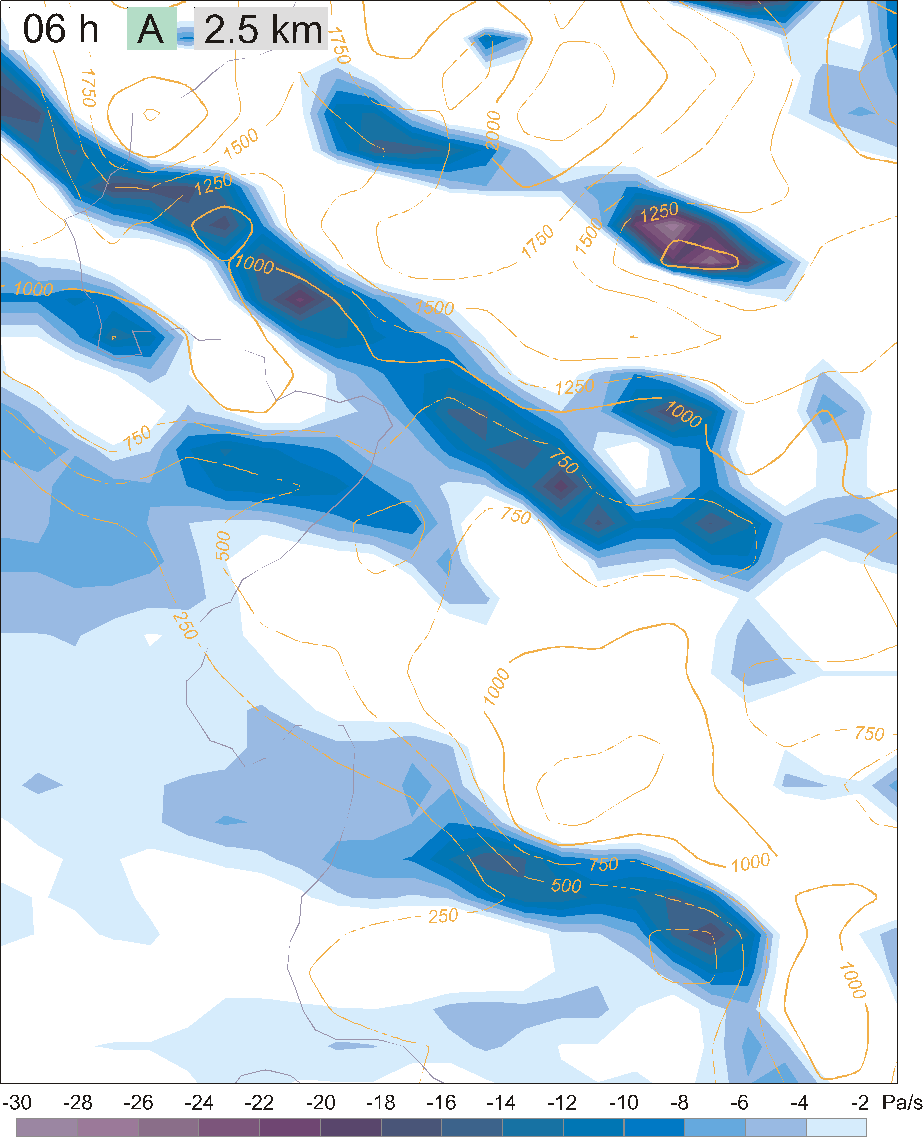
Figure 2: November 7, 1997, 6 UTC, vertical velocity at the 20th level (approximately 1400 m above the ground), forecast by a 6h integration of the complete model at resolution 2.5 km (left), and obtained by 30 minutes of dynamic adaptation from the initial state, in which the atmospheric fields are those of the left-hand-side of fig. 1 (right). The relief is also traced.
We employ three approaches of the diagnosis of precipitations from the field of adapted vertical velocities:
 ,
which connects the intensity of precipitations to the vertical velocities,
coefficient a is obtained by the linear regression, as it is obvious in
fig. 3. Index " LS " specifies that this relation is obtained on the
large scale (in the driving model) and the mass flux is an integral value
through the layer of formation of precipitations. Once a is determined,
it is used to diagnose the intensity of the precipitations, caused by adapted
vertical velocities:
,
which connects the intensity of precipitations to the vertical velocities,
coefficient a is obtained by the linear regression, as it is obvious in
fig. 3. Index " LS " specifies that this relation is obtained on the
large scale (in the driving model) and the mass flux is an integral value
through the layer of formation of precipitations. Once a is determined,
it is used to diagnose the intensity of the precipitations, caused by adapted
vertical velocities: , where "HR" means "high-resolution".
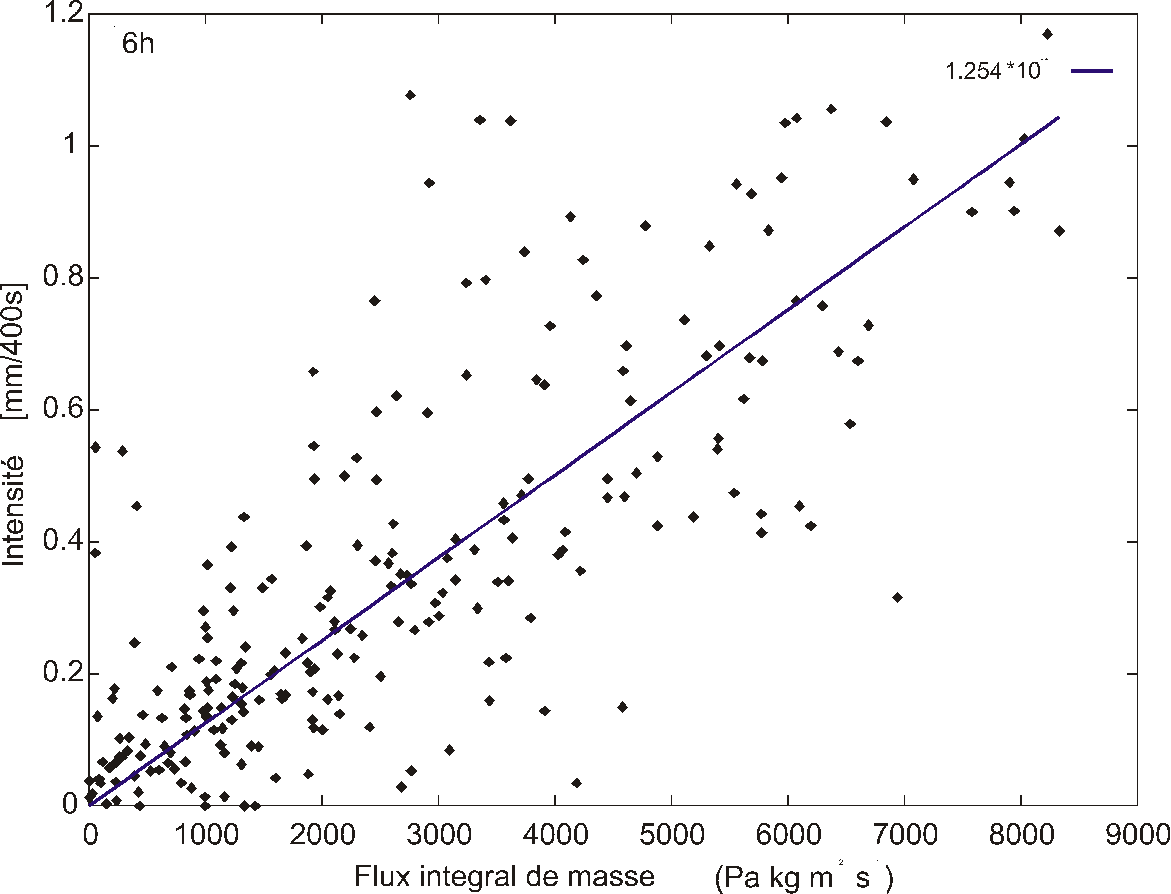
Figure 3: The relation between the intensity of precipitations and the vertical ascent in the driving model.
 .
Here zb and zt represent the base and the
top of the cloud, ga is the dry
adiabatic vertical gradient of the temperature and g
s is the vertical course of the temperature in the
ascending, saturated air.
.
Here zb and zt represent the base and the
top of the cloud, ga is the dry
adiabatic vertical gradient of the temperature and g
s is the vertical course of the temperature in the
ascending, saturated air.
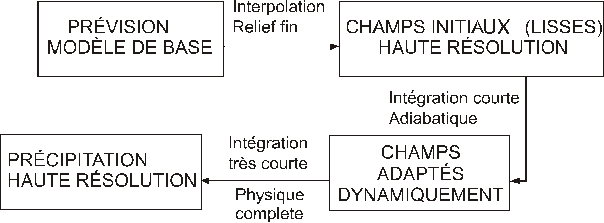
Figure 4: Individual phases of the dynamic adaptation of the wind and vertical speed in order to feed the one-dimensional model.
For verifications, observations on a mesh much denser than the current one are necessary. Apart of the means like the radar and the satellite, observations of precipitations at the resolution 2.5 km will not be available before a long time. Thus, and to answer to the aim of this research, which is to approach a as much as possible to the high resolution model by simple means and of moderate cost, the only suitable evaluations of all the methods are those compared to the model of reference, and those of the methods between them. Let us recall that the model of reference is turned in operational mode with complete physics and at high resolution. On figures 5 and 6 one can compare the results of the described methods of the diagnosis of the intensity of precipitations with the model at low resolution and with the model of reference.
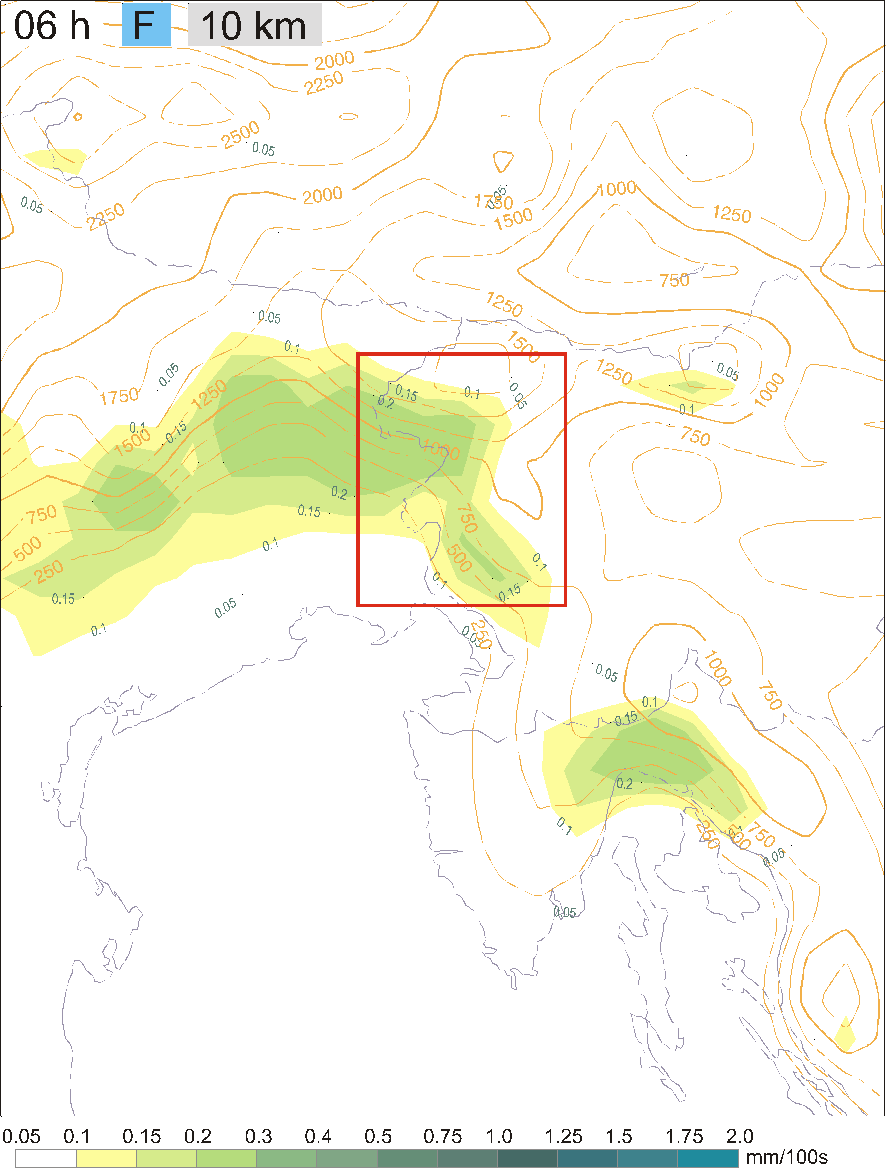

Figure 5: November 7, 1997, 6 UTC, intensity of precipitations, forecast by driving model (operational ALADIN/SI at resolution 11.2 km) (left), and by a 6h integration of the complete model (of reference) at resolution 2.5 km (right). The relief is also traced.

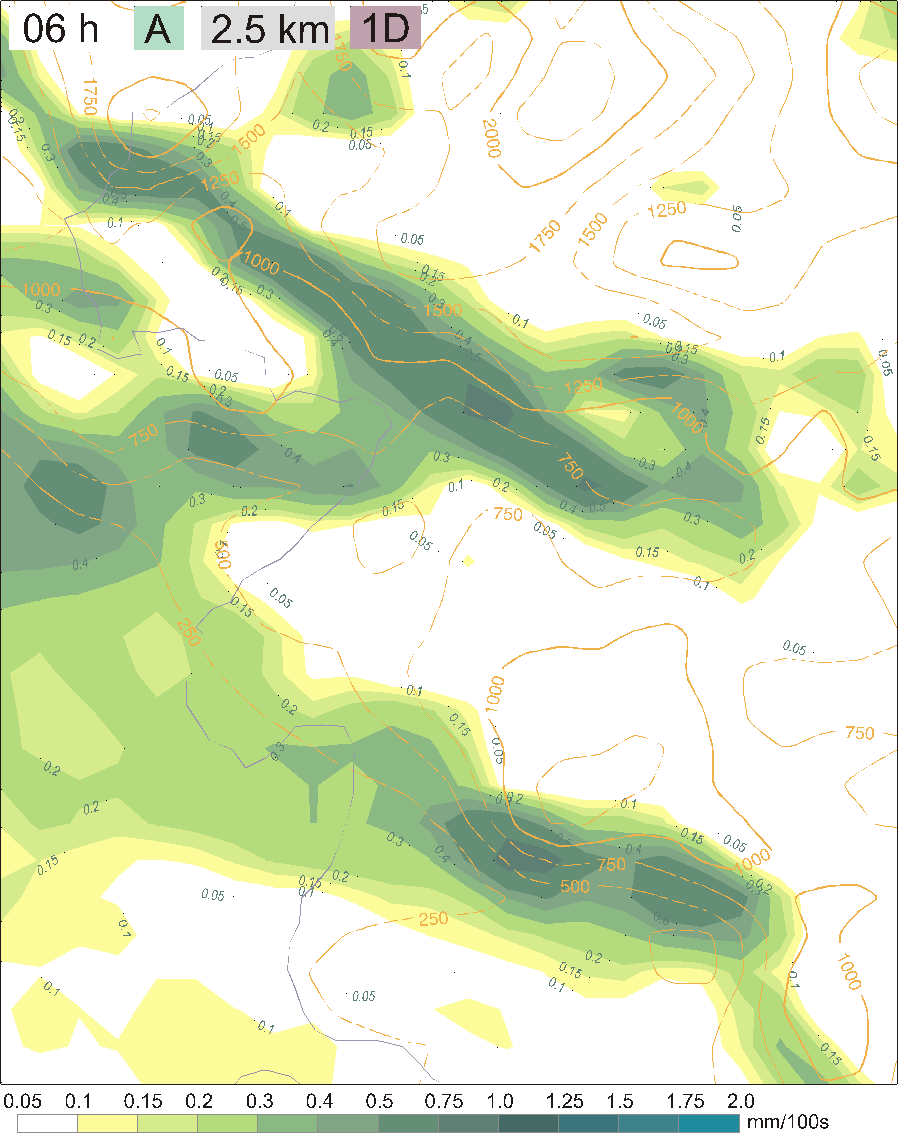
Figure 6: November 7, 1997, 6 UTC, intensity of precipitations, forecast by statistical method (left), and with the quasi-onedimensional model (right). The relief is also traced.
The method by adiabatic adjustment gives also comparable results.
A considerable part of the work for this research was carried out at Météo France, CNRM/GMAP.
Zagar, M. et J. Rakovec, 1999: Small-Scale Surface Wind Prediction using Dynamic Adaptation. Tellus, 51A , 489--504.